NFL DRAFT ROOKIE GUIDE IS NOW LIVE!
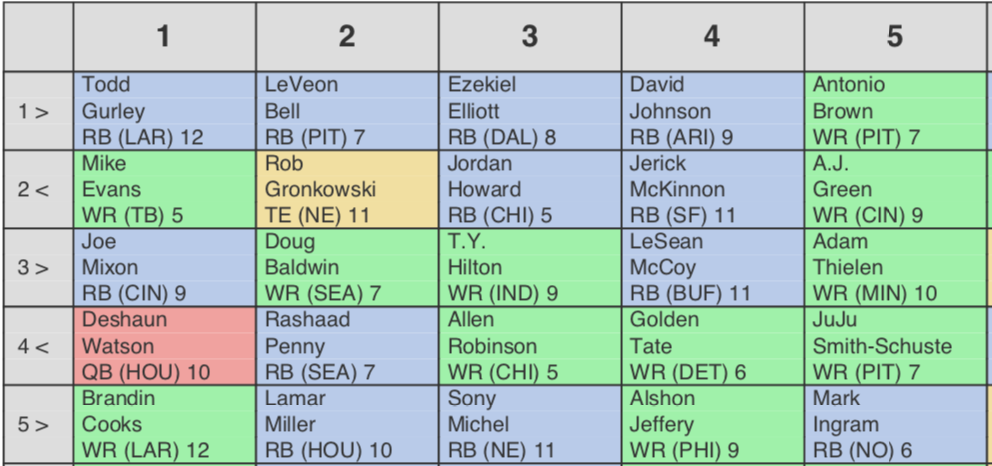
Data from 1535 fantasy football mock drafts between September 6, 2010 and September 8, 2010. More info
Note: This data is archived from 2010. You probably won't want to draft from this. View current ADP data.

| # | Pick | Name | Pos | Team | Overall | Std. Dev |
High | Low | Times Drafted |
|
|---|---|---|---|---|---|---|---|---|---|---|
| 1 | 11.10 | Nate Kaeding | PK | LAC | 130.5 | 18.8 | 1.12 | 14.04 | 191 | |
| 2 | 12.06 | Mason Crosby | PK | GB | 138.5 | 17.5 | 2.05 | 14.05 | 163 | |
| 3 | 12.11 | Garrett Hartley | PK | NO | 143.0 | 16.8 | 5.01 | 15.08 | 188 | |
| 4 | 13.07 | Stephen Gostkowski | PK | NE | 150.8 | 12.9 | 8.11 | 15.05 | 116 | |
| 5 | 14.07 | Ryan Longwell | PK | MIN | 162.7 | 10.6 | 7.04 | 15.12 | 199 | |
| 6 | 14.09 | Rob Bironas | PK | TEN | 164.9 | 9.5 | 11.04 | 15.10 | 104 | |
| 7 | 14.11 | David Akers | PK | PHI | 166.8 | 10.3 | 9.03 | 15.12 | 293 | |
| 8 | 14.12 | Adam Vinatieri | PK | IND | 168.0 | 10.8 | 10.12 | 15.12 | 111 | |
| 9 | 15.02 | Sebastian Janikowski | PK | LV | 169.7 | 9.9 | 13.01 | 15.11 | 24 | |
| 10 | 15.03 | Robbie Gould | PK | CHI | 170.6 | 6.6 | 13.04 | 15.12 | 28 | |
| 11 | 15.03 | Neil Rackers | PK | HOU | 170.9 | 7.6 | 12.04 | 15.12 | 107 |
Print out a PDF of the user-friendly draft board view!
It's part of the one-of-a-kind Premium Membership!
Get the Printable ADP Now!ADP: Average Draft Position (ADP) is a list of NFL players ordered by their average position taken in fantasy football drafts. The average value of their draft position is taken over a range of many drafts. Computer selections are filtered out, and only human selections are considered. Useful for fantasy draft preparation.
Detailed information on these average draft position calculations can be found here.
Use this ADP data for free in your website or application with our REST API. Learn more.
For in-season advice, use our rankings to find out Who should I start?


Copyright 2024 Fantasy Football Calculator | Image Source: Icon Sportswire. Not affiliated with the National Football League (NFL).
Stats powered by FantasyData.com.